花了一周时间尝试写了第一个融合了MatMul和Softmax操作的Spine-Triton算子。其间遇到的最主要问题是不知道如何恰当地可视化Triton内核的性能测量结果。
先上结论:
- python/examples/benchmark.py 可以测量程序运行时间
- Triton内置的性能分析工具Proton尚不可用
- py-spy没有安装源
- torch.profiler和cProfile可用
- Triton内核需要包装为PyTorch算子才能在trace中占用时间,否则该段时间为空白
再上代码:
test_fused_mm_softmax.zip (174.9 KB)
最后是多种测量结果和对应的代码:
- python/examples/benchmark.py给出的打印
(spine-triton) bibo@spacemit-k1-x-deb1-board:~/work/git-spine-triton$ python3 python/examples/test_fused_mm_softmax.py
bench_fused_matmul_softmax(128, 'test') {}, 20 times, all results in seconds
Wall: Avg=0.588080, min=0.051605, std=2.224419, max=10.283790
CPU: Avg=1.093126, min=0.397783, std=2.142091, max=10.412320
bench_fused_matmul_softmax(128, 'torch') {}, 20 times, all results in seconds
Wall: Avg=0.007256, min=0.007055, std=0.000171, max=0.007744
CPU: Avg=0.050503, min=0.048859, std=0.000912, max=0.052585
bench_fused_matmul_softmax(128, 'triton') {}, 20 times, all results in seconds
Wall: Avg=0.024023, min=0.015709, std=0.014994, max=0.067538
CPU: Avg=0.121871, min=0.049725, std=0.137653, max=0.462098
bench_fused_matmul_softmax(256, 'test') {}, 20 times, all results in seconds
Wall: Avg=0.251904, min=0.113338, std=0.349976, max=1.761981
CPU: Avg=1.281263, min=0.729294, std=0.438482, max=1.880689
bench_fused_matmul_softmax(256, 'torch') {}, 20 times, all results in seconds
Wall: Avg=0.038926, min=0.037231, std=0.002301, max=0.047075
CPU: Avg=0.281972, min=0.192759, std=0.037908, max=0.314290
bench_fused_matmul_softmax(256, 'triton') {}, 20 times, all results in seconds
Wall: Avg=0.086476, min=0.080030, std=0.016188, max=0.146810
CPU: Avg=0.376223, min=0.310306, std=0.194168, max=1.166171
bench_fused_matmul_softmax(512, 'test') {}, 20 times, all results in seconds
Wall: Avg=0.956295, min=0.862102, std=0.342548, max=2.448573
CPU: Avg=5.101759, min=4.297135, std=0.192135, max=5.230515
bench_fused_matmul_softmax(512, 'torch') {}, 20 times, all results in seconds
Wall: Avg=0.286390, min=0.276945, std=0.007014, max=0.302214
CPU: Avg=1.678116, min=1.523133, std=0.044992, max=1.710091
bench_fused_matmul_softmax(512, 'triton') {}, 20 times, all results in seconds
Wall: Avg=0.529977, min=0.524835, std=0.015496, max=0.597319
CPU: Avg=2.367311, min=2.302564, std=0.251796, max=3.464647
主程序中遍历了128x128、256x256、512x512三种矩阵大小,并遍历了’test’、‘torch’、'triton’三种测试。其中‘test’测试比较了‘torch’和‘triton’算子运行的结果。每种测试连续运行20次。
测试代码如下:
@benchmark.measure()
def bench_fused_matmul_softmax(N, provider):
    device = 'cpu'
    dtype = torch.float32
    a = torch.randn((N, N), device=device, dtype=dtype)
    b = torch.randn((N, N), device=device, dtype=dtype)
    c = torch.empty((N, N), device=device, dtype=dtype)
    if provider == 'torch' or provider == 'test':
        c_ref = torch.softmax(torch.matmul(a, b), axis=0)
    if provider == 'triton' or provider == 'test':
        # bare_fused_mm_softmax[(1,)](a, b, c, N, N, N, N)
        c = torch.ops.mylib.triton_fused_mm_softmax.default(a, b)
        if provider == 'test':
            torch.testing.assert_close(c, c_ref, atol=1e-2, rtol=0)
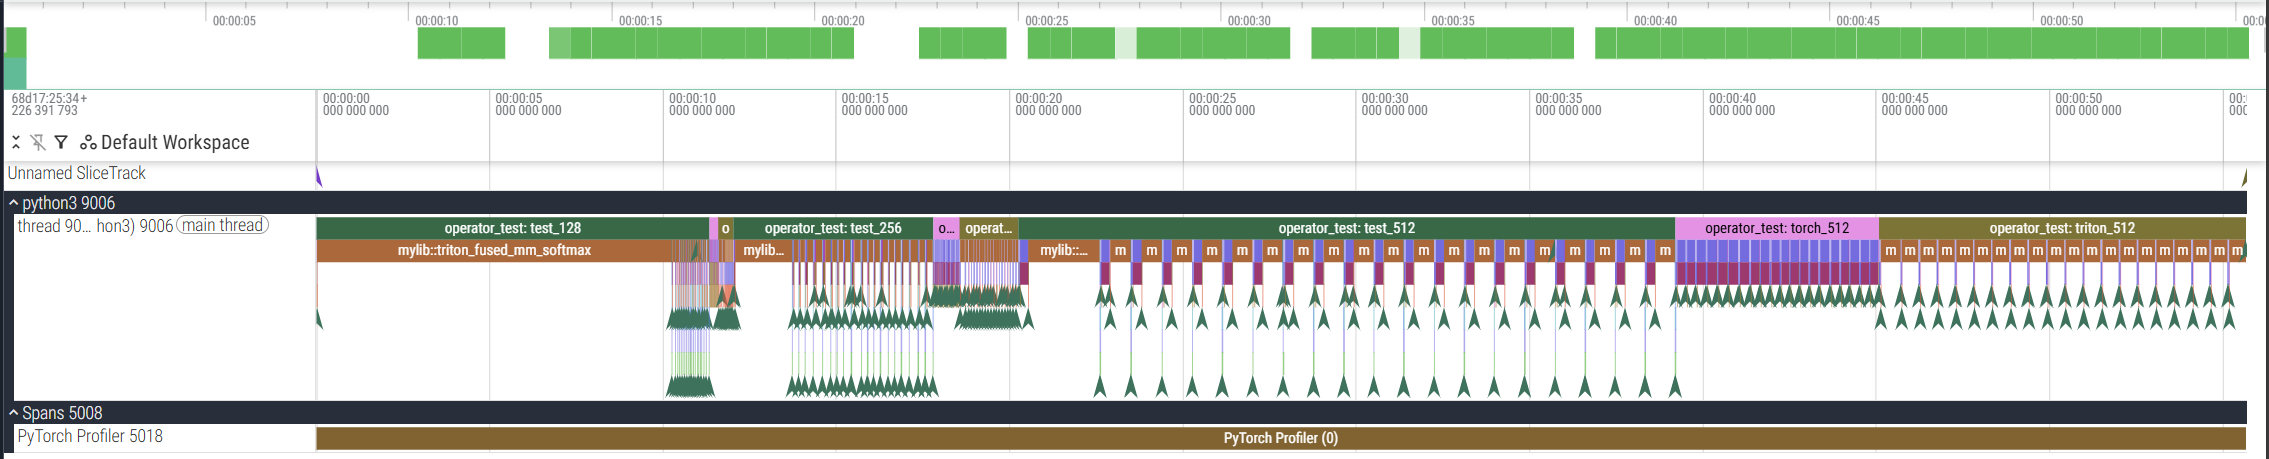
- torch.profiler测量结果及可视化:
----------------------------------  ------------  ------------  ------------  ------------  ------------  ------------  ------------  ------------
                              Name    Self CPU %      Self CPU   CPU total %     CPU total  CPU time avg       CPU Mem  Self CPU Mem    # of Calls
----------------------------------  ------------  ------------  ------------  ------------  ------------  ------------  ------------  ------------
    mylib::triton_fused_mm_softmax        72.50%       40.193s        72.53%       40.210s     335.084ms      52.50 MB           0 B           120
           operator_test: test_512         0.10%      58.095ms        34.51%       19.131s       19.131s           0 B    -125.00 MB             1
           operator_test: test_128         0.08%      45.159ms        21.23%       11.773s       11.773s           0 B      -7.81 MB             1
         operator_test: triton_512         0.04%      21.466ms        19.13%       10.605s       10.605s           0 B     -80.00 MB             1
                      aten::matmul         0.01%       4.094ms        19.12%       10.602s      88.347ms      52.50 MB           0 B           120
                          aten::mm        19.11%       10.597s        19.11%       10.598s      88.313ms      52.50 MB      52.50 MB           120
          operator_test: torch_512         0.04%      23.665ms        10.34%        5.733s        5.733s           0 B    -100.00 MB             1
           operator_test: test_256         0.08%      42.651ms         9.10%        5.044s        5.044s           0 B     -31.25 MB             1
                       aten::randn         0.03%      17.130ms         6.34%        3.517s       9.770ms     157.50 MB           0 B           360
                     aten::normal_         6.29%        3.485s         6.29%        3.485s       9.680ms           0 B           0 B           360
----------------------------------  ------------  ------------  ------------  ------------  ------------  ------------  ------------  ------------
Self CPU time total: 55.442s
测量代码如下:
    # Pytorch Profiler
    from torch.profiler import profile, record_function, ProfilerActivity
    with profile(activities=[ProfilerActivity.CPU], profile_memory=True) as prof:
        for X in [2**i for i in range(7, 10, 1)]:
            for provider in ['test', 'torch', 'triton']:
                with record_function("operator_test: " + provider + "_" + str(X)):
                    bench_fused_matmul_softmax(X, provider)

    print(prof.key_averages().table(sort_by="cpu_time_total", row_limit=10))
    prof.export_chrome_trace("profiler_export_trace.json")
- cProfile测量结果的可视化
测量代码如下:
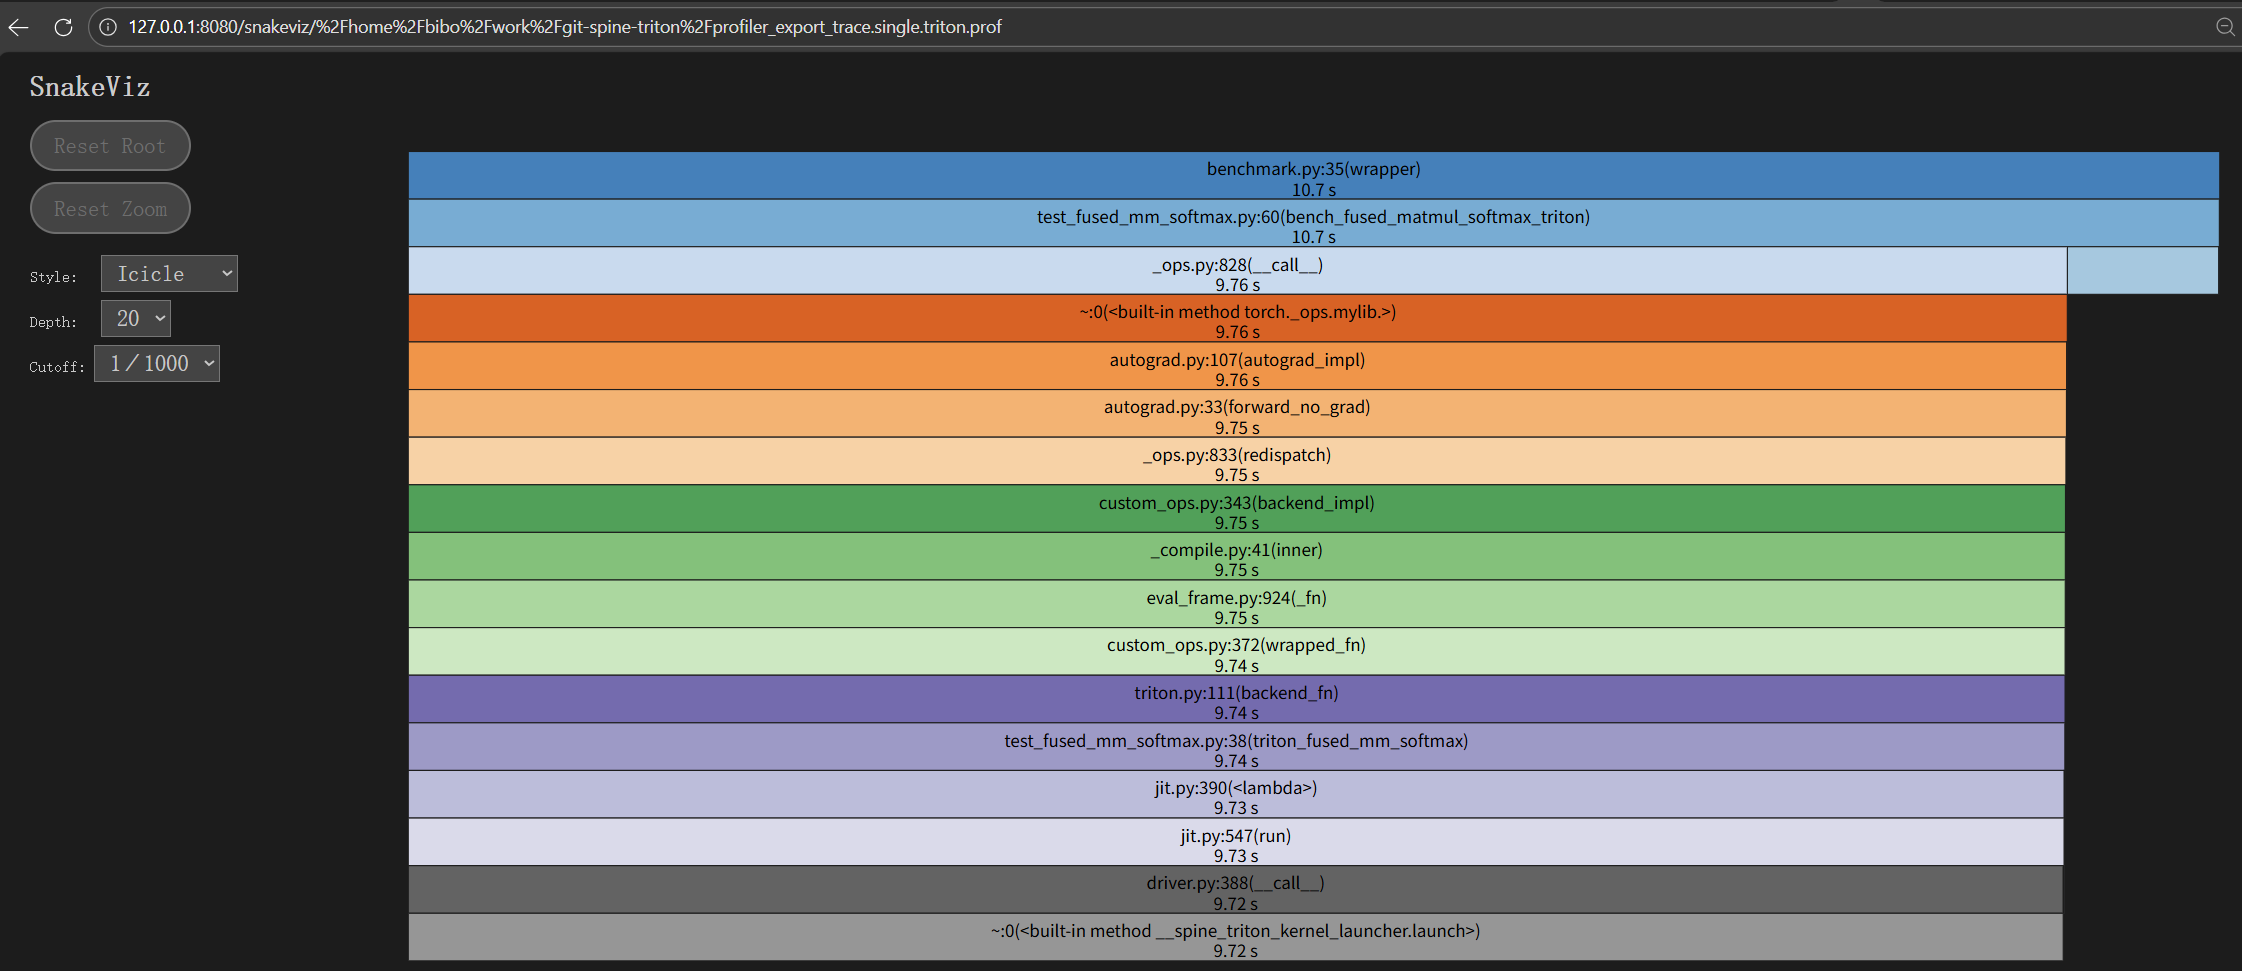
    # Python Profiler
    import cProfile
    profiler = cProfile.Profile()

    # N = 512
    # device = 'cpu'
    # dtype = torch.float32

    profiler.enable()
    # a = torch.randn((N, N), device=device, dtype=dtype)
    # b = torch.randn((N, N), device=device, dtype=dtype)
    # c = torch.empty((N, N), device=device, dtype=dtype)
    # bare_fused_mm_softmax[(1,)](a, b, c, N, N, N, N)
    # wrapper_triton(a, b, c, N)
    bench_fused_matmul_softmax_triton(512)
    profiler.disable()
    profiler.dump_stats("profiler_export_trace.single.triton.prof")
其中注释掉的部分保留了在测量结果中显示Triton内核运行时间的不成功尝试。
- 使用
triton_op包装 Triton 内核的代码
# Wrap the torch kernel as a PyTorch operator
from torch.library import triton_op, wrap_triton
@triton_op("mylib::triton_fused_mm_softmax", mutates_args={})
def triton_fused_mm_softmax(a: torch.Tensor, b: torch.Tensor) -> torch.Tensor:
    c = torch.empty_like(a)
    n_elements = a[0].numel()
    wrap_triton(bare_fused_mm_softmax)[(1,)](a, b, c, n_elements, n_elements, n_elements, BLOCK_SIZE=n_elements)
    return c
- MatMul与Softmax融合的算子代码
@triton.jit
def bare_fused_mm_softmax(X, Y, Z, M, N, K, BLOCK_SIZE: tl.constexpr):
    pid_x = tl.program_id(0)  # block row id
    pid_y = tl.program_id(1)  # block column id

    offs_x = pid_x * BLOCK_SIZE + tl.arange(0, BLOCK_SIZE)
    offs_y = pid_y * BLOCK_SIZE + tl.arange(0, BLOCK_SIZE)

    x = tl.load(X + offs_x[:, None] * K + offs_y[None, :])
    y = tl.load(Y + offs_x[:, None] * N + offs_y[None, :])

    z = tl.dot(x, y)
    z = bare_softmax(z)

    tl.store(Z + offs_x[:, None] * N + offs_y[None, :], z)

@triton.jit
def bare_softmax(row):
    # Subtract maximum for numerical stability
    row_minus_max = row - tl.max(row, axis=0)
    # Note that exponentiation in Triton is fast but approximate (i.e., think __expf in CUDA)
    numerator = tl.exp(row_minus_max)
    denominator = tl.sum(numerator, axis=0)
    return numerator / denominator
从测量结果上看,我自己写的Triton内核在性能上是比不上K1上PyTorch算子的。